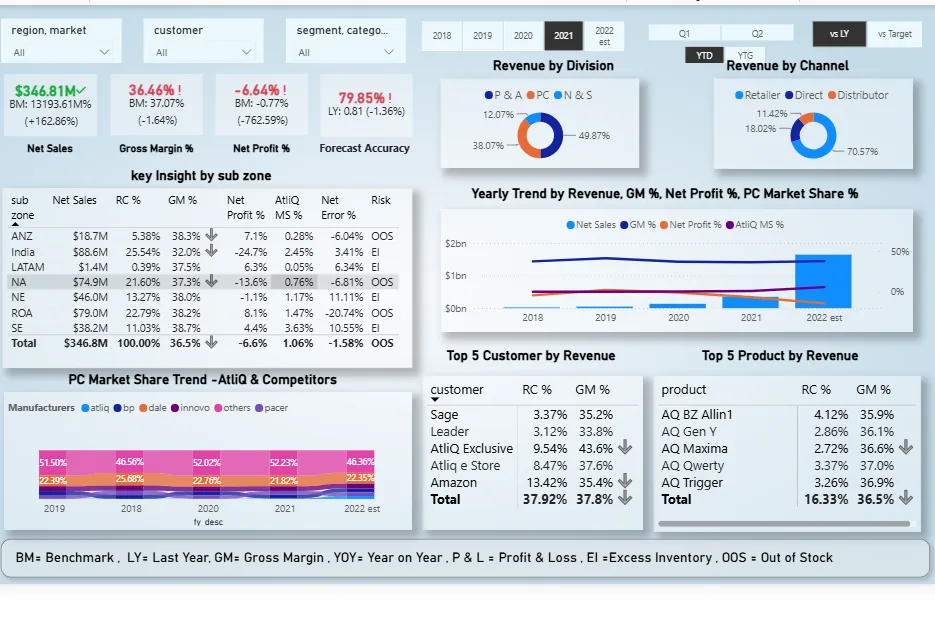
Business 360 Dashboard
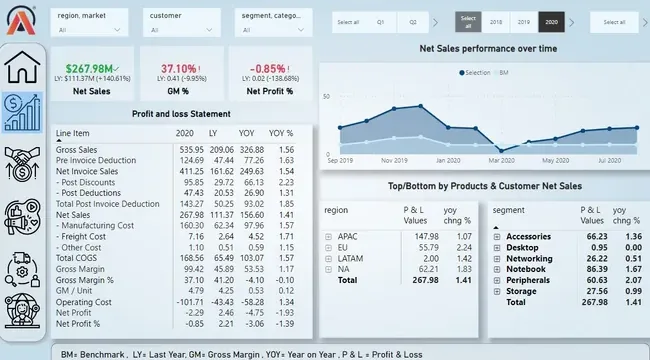
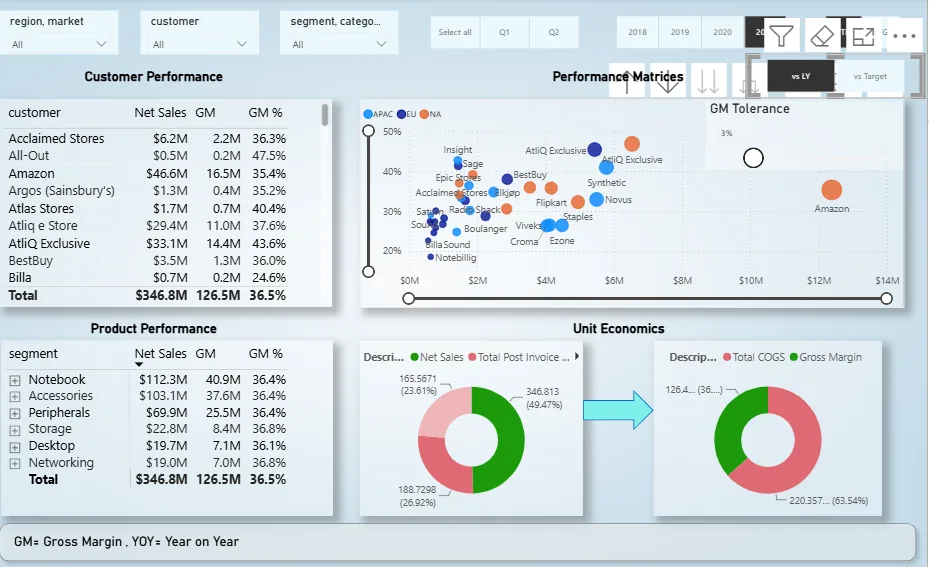
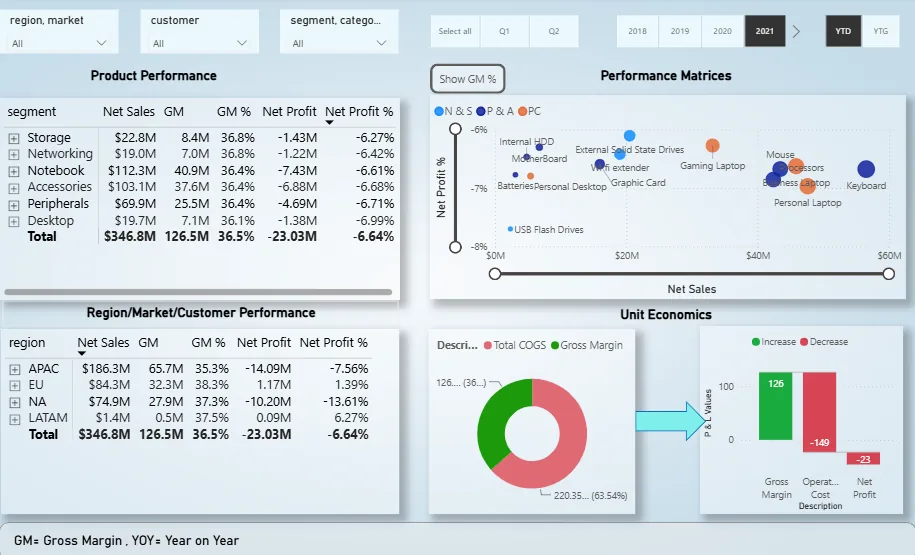
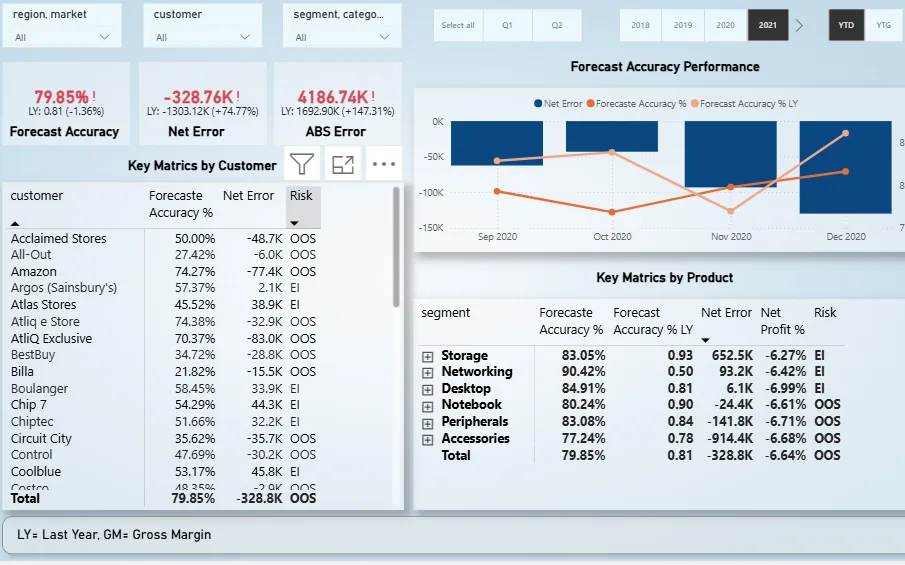
A Power BI dashboard built for the Codebasics Data Analytics Bootcamp, on a supplied scenario and dummy data: AtliQ, a computer-hardware distributor, needed one dashboard to replace scattered Excel reporting. I built five views — Finance, Sales, Marketing, Supply Chain and Executive — covering everything from P&L and margin to forecast accuracy and market share.
- Type
- Instructor-led Codebasics Data Analytics Bootcamp project, supplied scenario and dummy data
- Tools
- Power BI, DAX, Power Query, MySQL, Excel
The dashboard
Finance covers P&L and margin; Sales and Marketing cover customer, product and market performance; Supply Chain tracks forecast accuracy and risk; Executive rolls it all up for leadership. DAX measures handle benchmark comparisons against last year and target, and a Power Query-modelled data set drives the whole report.